This post is part of a series:
- Jenkins.NET
- Jenkins.NET Plugins
- Setup Jenkins.NET
- Setting up your first job
- Your first build
- Breaking the build
- Diagnosing and fixing a broken build
- Monitoring your build
- Running your tests
- Code Analysis
- Security
- Active Directory Security
Jenkins can run a series of code analysis tools after each build, this will help you monitor the health of your solution.
Compiler Warnings
Ideally your solution will have no compiler warnings and you can have your solution fail to build if the any warnings appear. I know in the real world this isn’t always possible, so we can utilize Jenkins to make sure the number of warnings do not get out of hand.
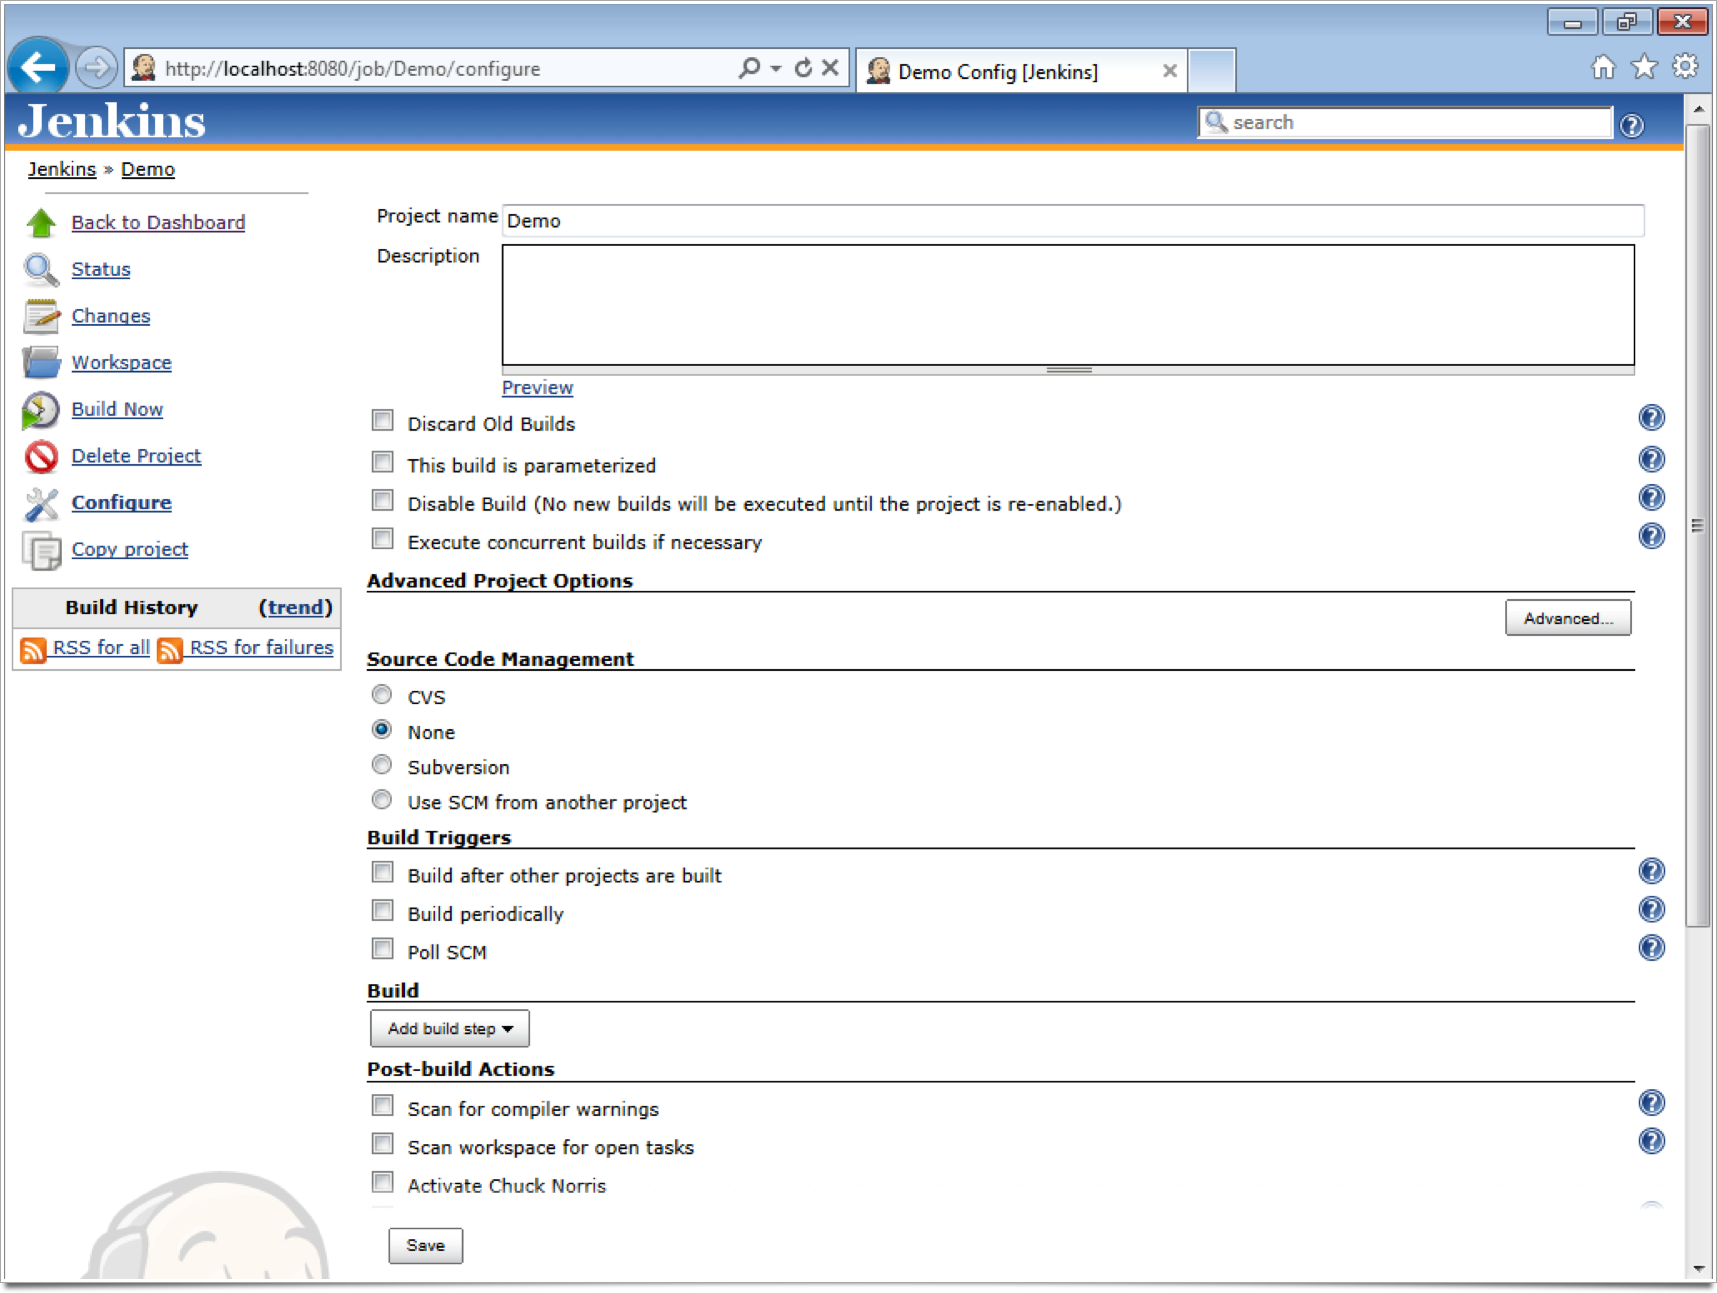
This is accessed via the Jobs configuration page, for our Demo job we click Jenkins » Demo » Configure. You’ll find the “Scan for compiler warnings” at the bottom of this page under the “Post-Build Actions” section.
Configure
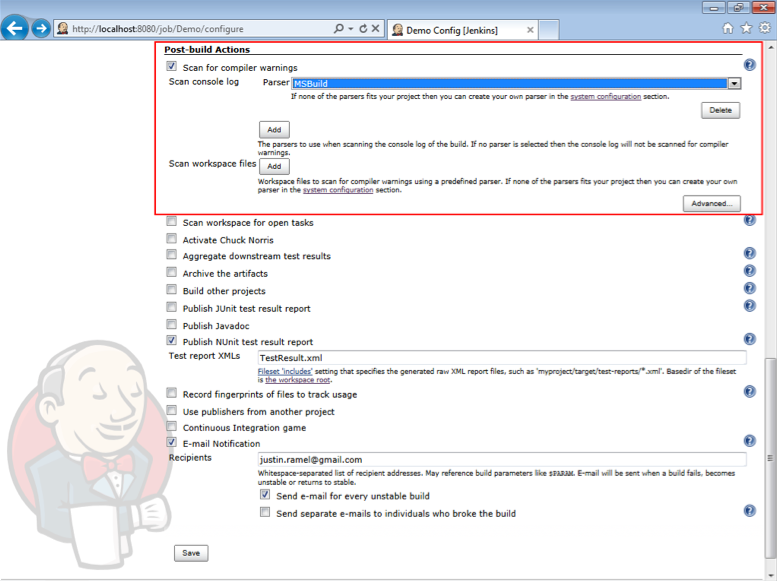
- Tick the “Scan for compiler warnings”
- Click the “Add” button under the “Scan console log” area
- Select MSBuild from the Parser drop down list
- Click the “Save” button
Now when you carry out a build, you’ll get a compiler warnings section as part of your build report.
Warnings report
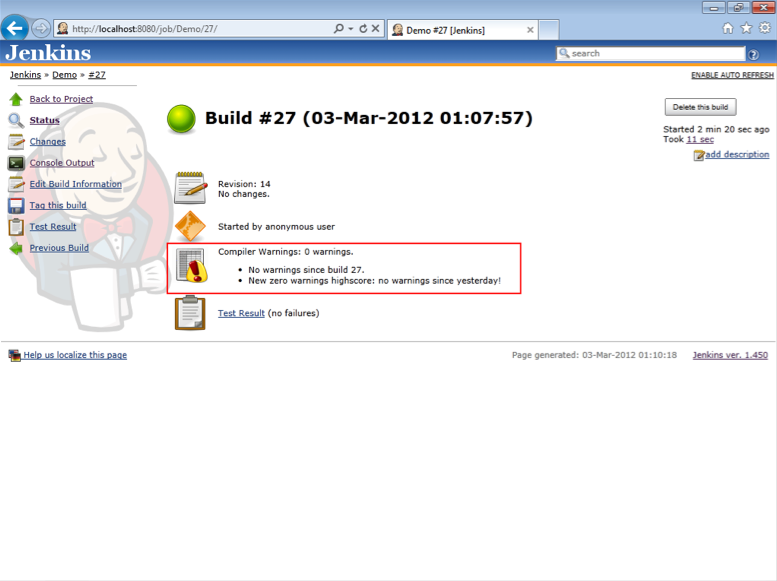
Here we have no compiler warnings so I’ll commit a warning to show the information Jenkins tracks.

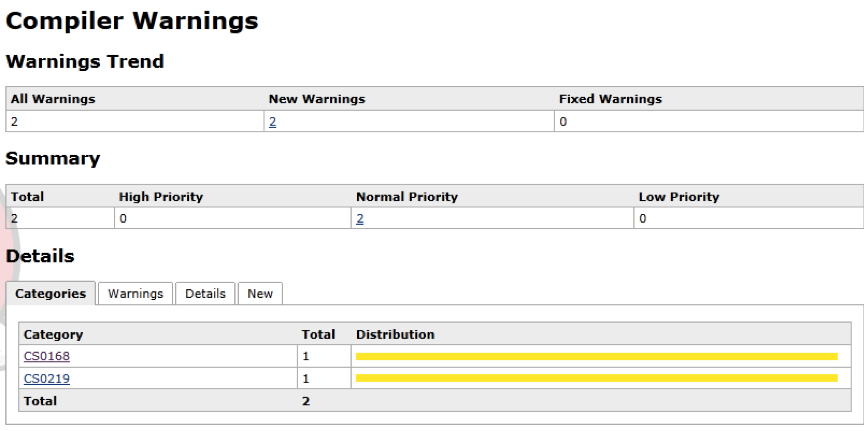
We now have 2 compiler warnings and we can drill down for more details by clicking the 2 warnings link.
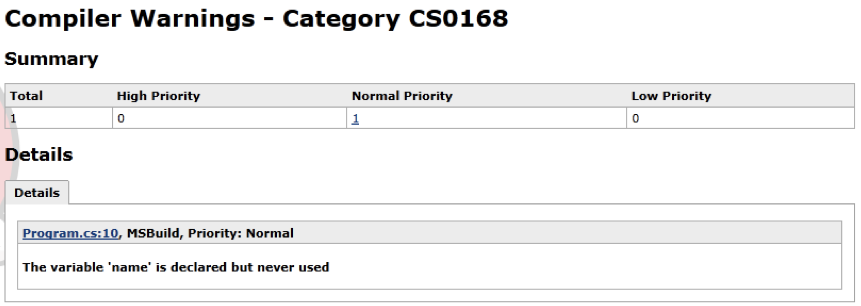
We can continue drilling and find the actual source file and line number causing the warning.
Trending
As well as the low level details Jenkins also gives us a Compiler Warnings Trend graph.
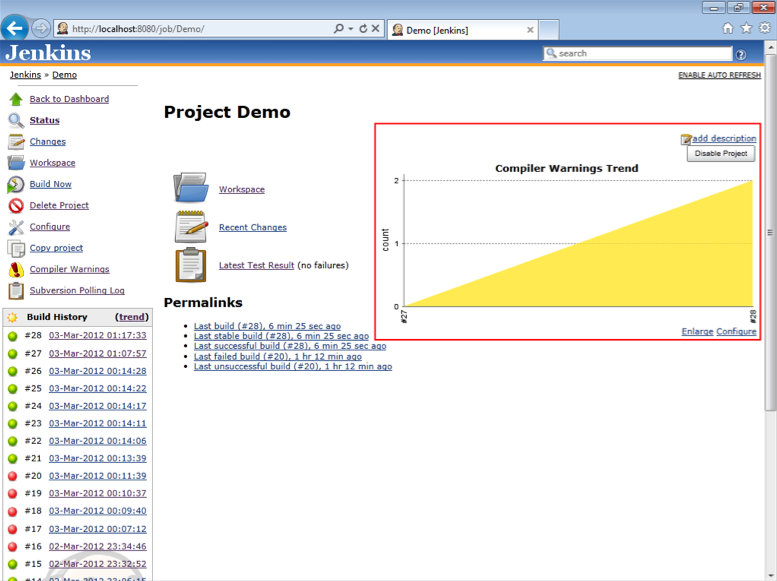
Your mission is to reverse this trend and keep your compiler warnings low or preferably non-existent.
Tasks and To-dos
Another sign of Technical Debt is lots of To-dos, hack, and fix-me comments in your code. Lets use Jenkins to monitor these type of comments. For our Demo job we click Jenkins » Demo » Configure. You’ll find the “Scan workspace for open tasks” at the bottom of this page under the “Post-Build Actions” section.
Configure
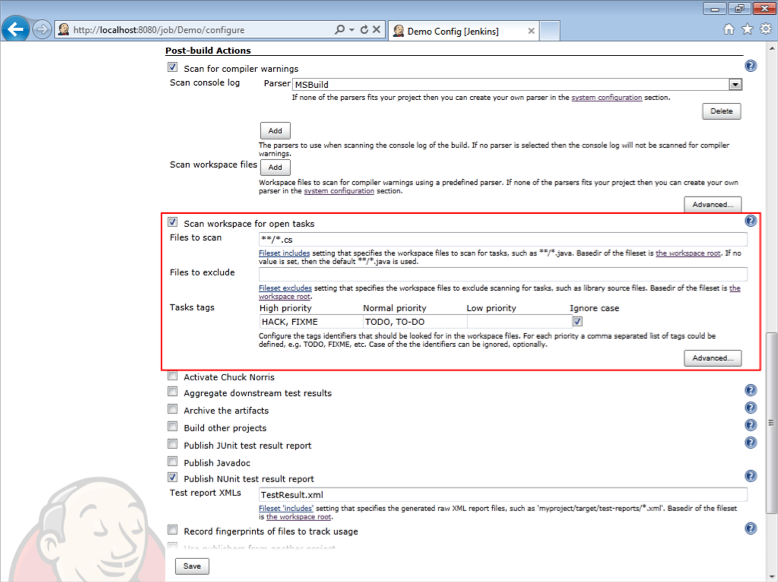
- Tick the “Scan workspace for open tasks” check box
- In the “Files to scan” textbox enter: */.cs which scans all C Sharp files for these comments.
- In the “Tasks tags” High priority textbox enter: HACK, FIXME
- In the “Tasks tags” Normal priority textbox enter: TODO, TO-DO
- Tick the “Ignore case” check box
- Click the “Save” button
These task tags can be anything you or your team use to indicate work that needs to be carried out in your source. When we carry out a build, we’ll get a compiler warnings section as part of our build report.
Task Scanner Report
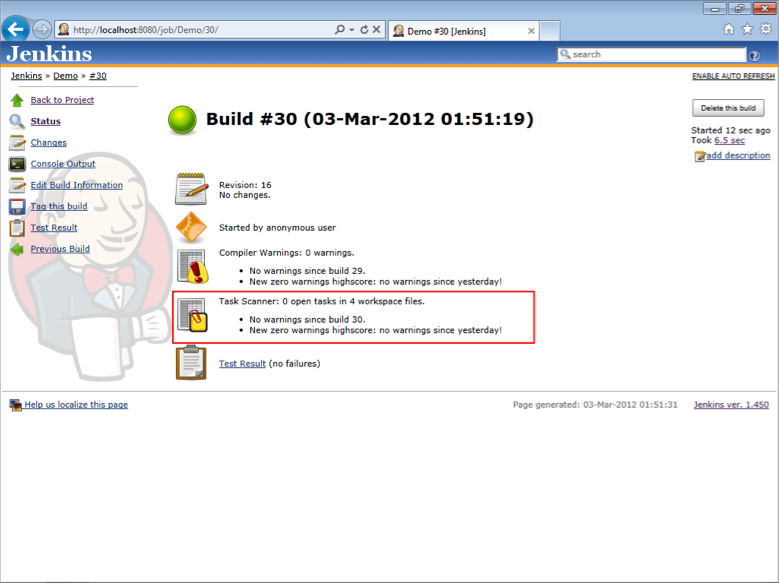
Here we have no tasks, I’ll commit a few To-dos and Hack comments to show the information Jenkins tracks.

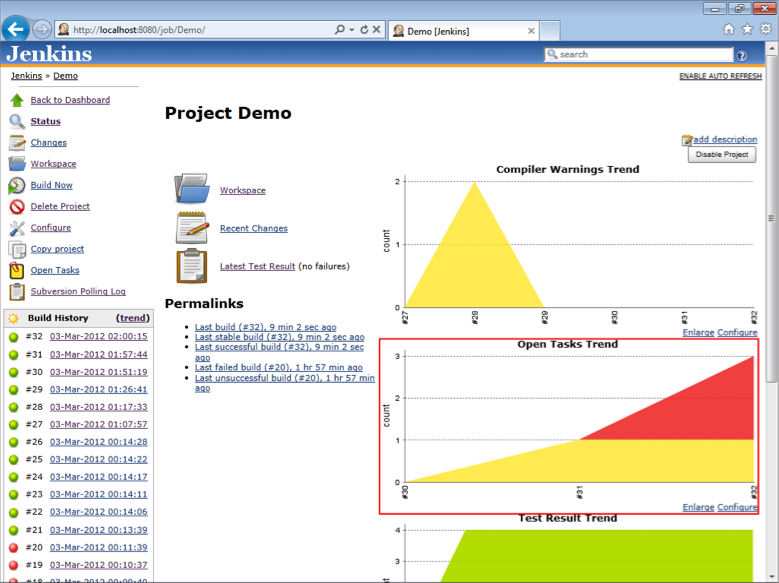
We now have 3 open tasks and we can drill down for more details by clicking the 3 open tasks link.
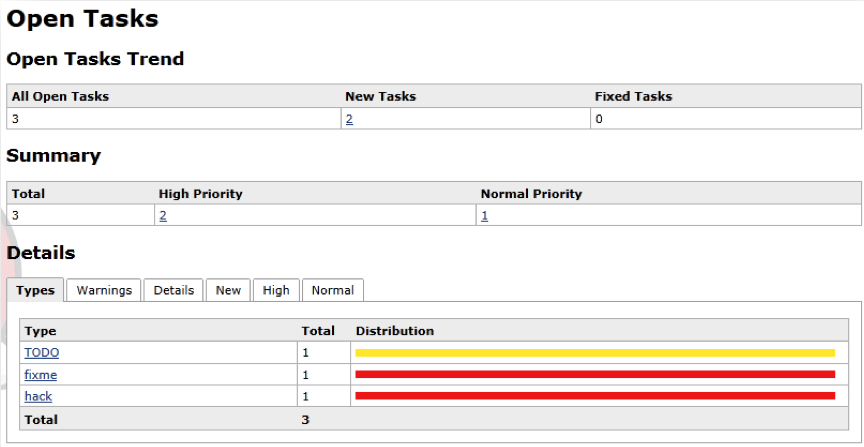
As you can see depending on the priority of the open task we get different color bars to indicate they severity.
We can continue drilling and find the actual source file and line number of the tasks.
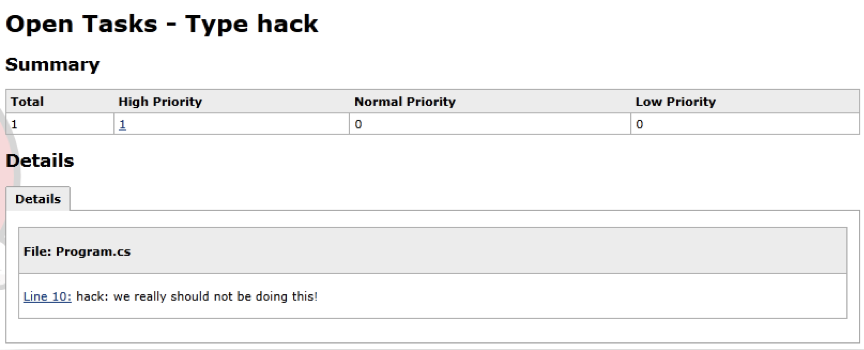
Trending
As well as the low level details Jenkins also gives us an Open Tasks Trend graph.





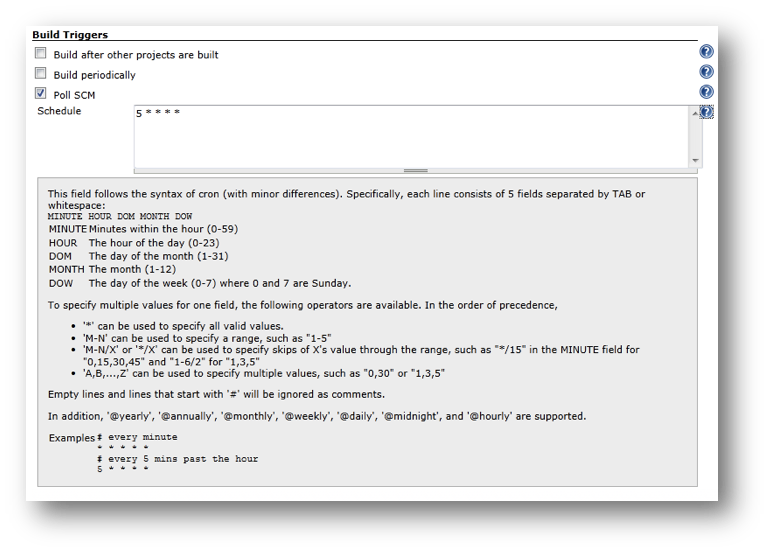
 icon) we can be extremely flexible
in how often we check the source code repository for changes. Checking every 5
minutes is my default as I tend make lots of small commits and I want to know
quickly if I’ve introduced a problem.