This post is part of a series:
- Jenkins.NET
- Jenkins.NET Plugins
- Setup Jenkins.NET
- Setting up your first job
- Your first build
- Breaking the build
- Diagnosing and fixing a broken build
- Monitoring your build
- Running your tests
- Code Analysis
- Security
- Active Directory Security
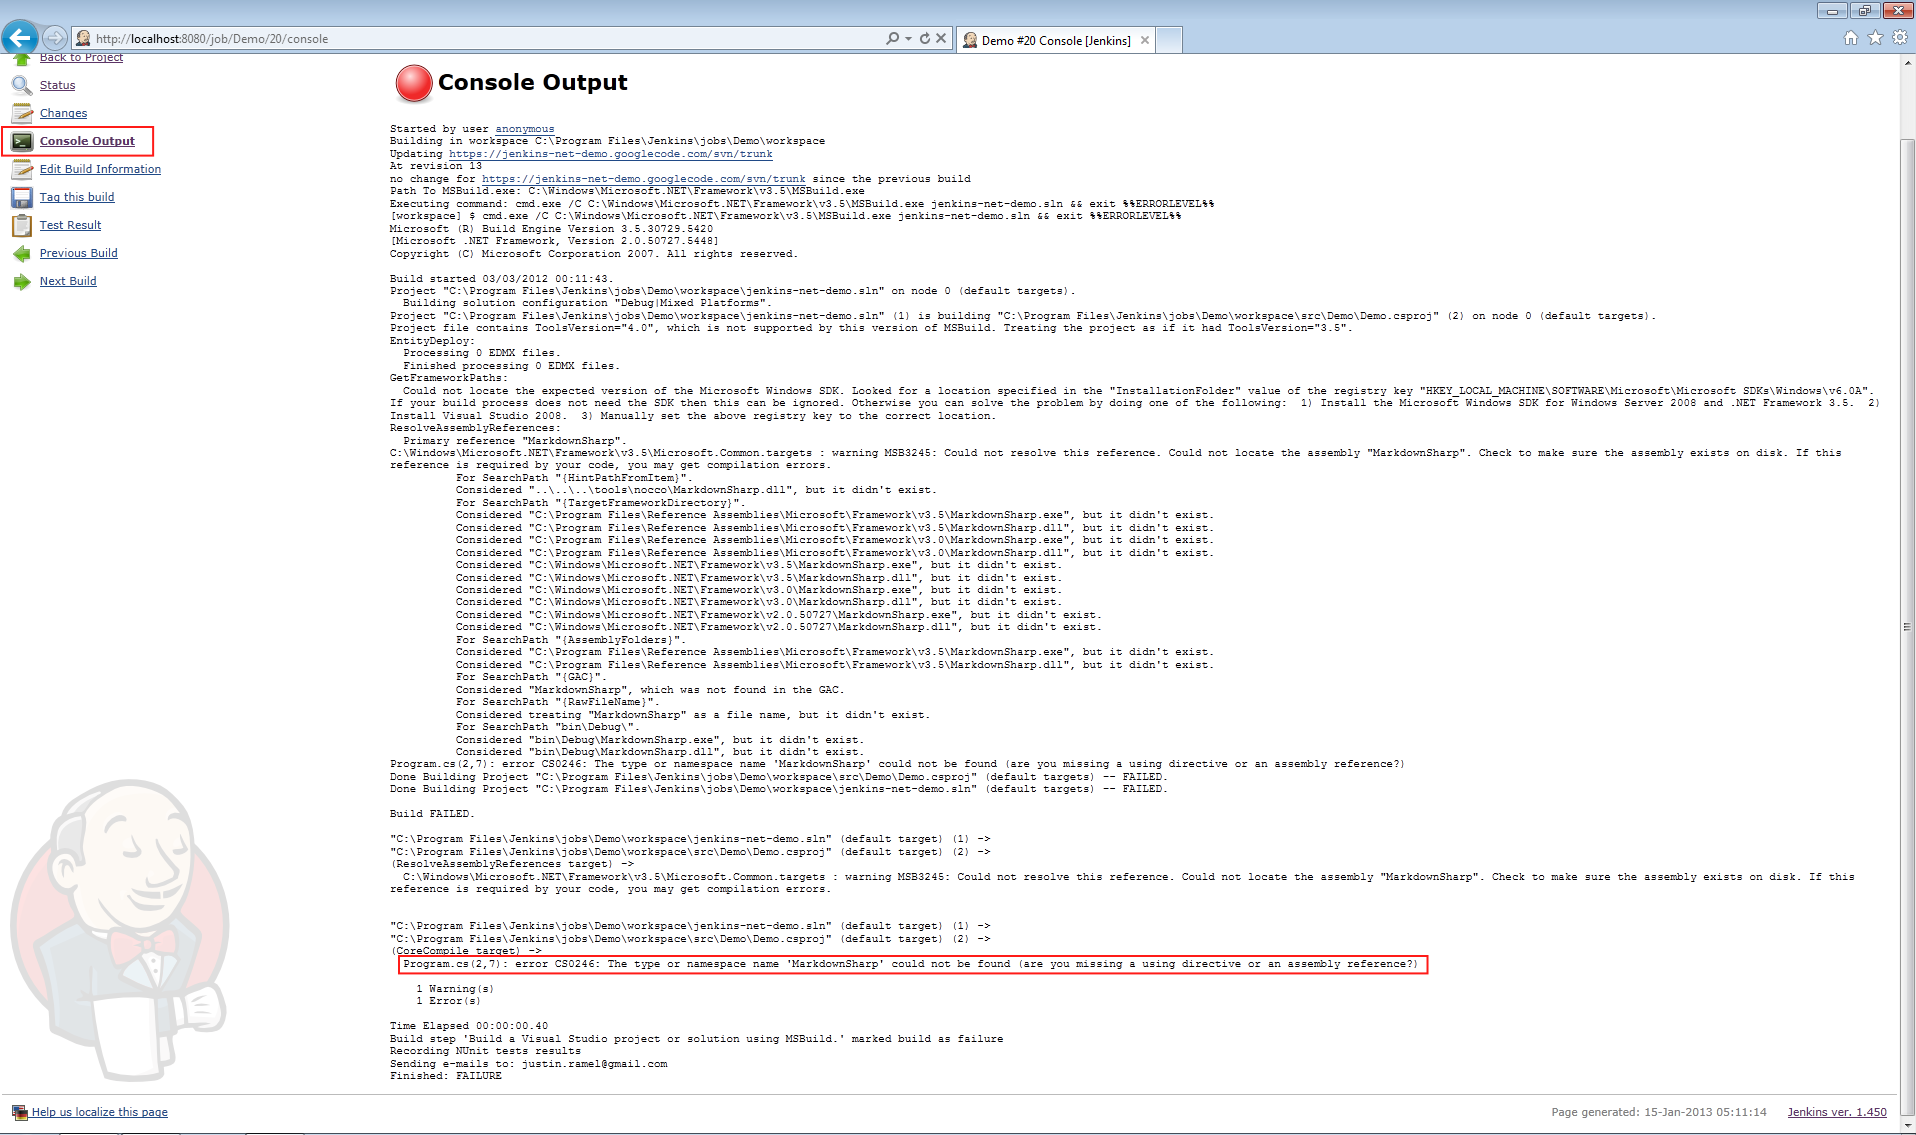
Last time we had a failing build with Jenkin’s showing a red ball to prove it. The first place to look when we have a failing build is the console output. You can get to the console output via the main menu on the left of your project page.
Console output

As the screenshot shows we get all the output from our build process and there is a lot of it! I’ve highlighted the actual problem which is the causing the build to fail, our missing dll.
This is the error your team mates will see when they check out and try to build your code.
Console “blindness”
When you first see the console output for your build it can be a little overwhelming, there is a lot of information packed into the output. Sometimes you look at all that information and you can’t see the wood for the trees, or the errors in all that output. I have seen people look at this output and they are blind to the errors.
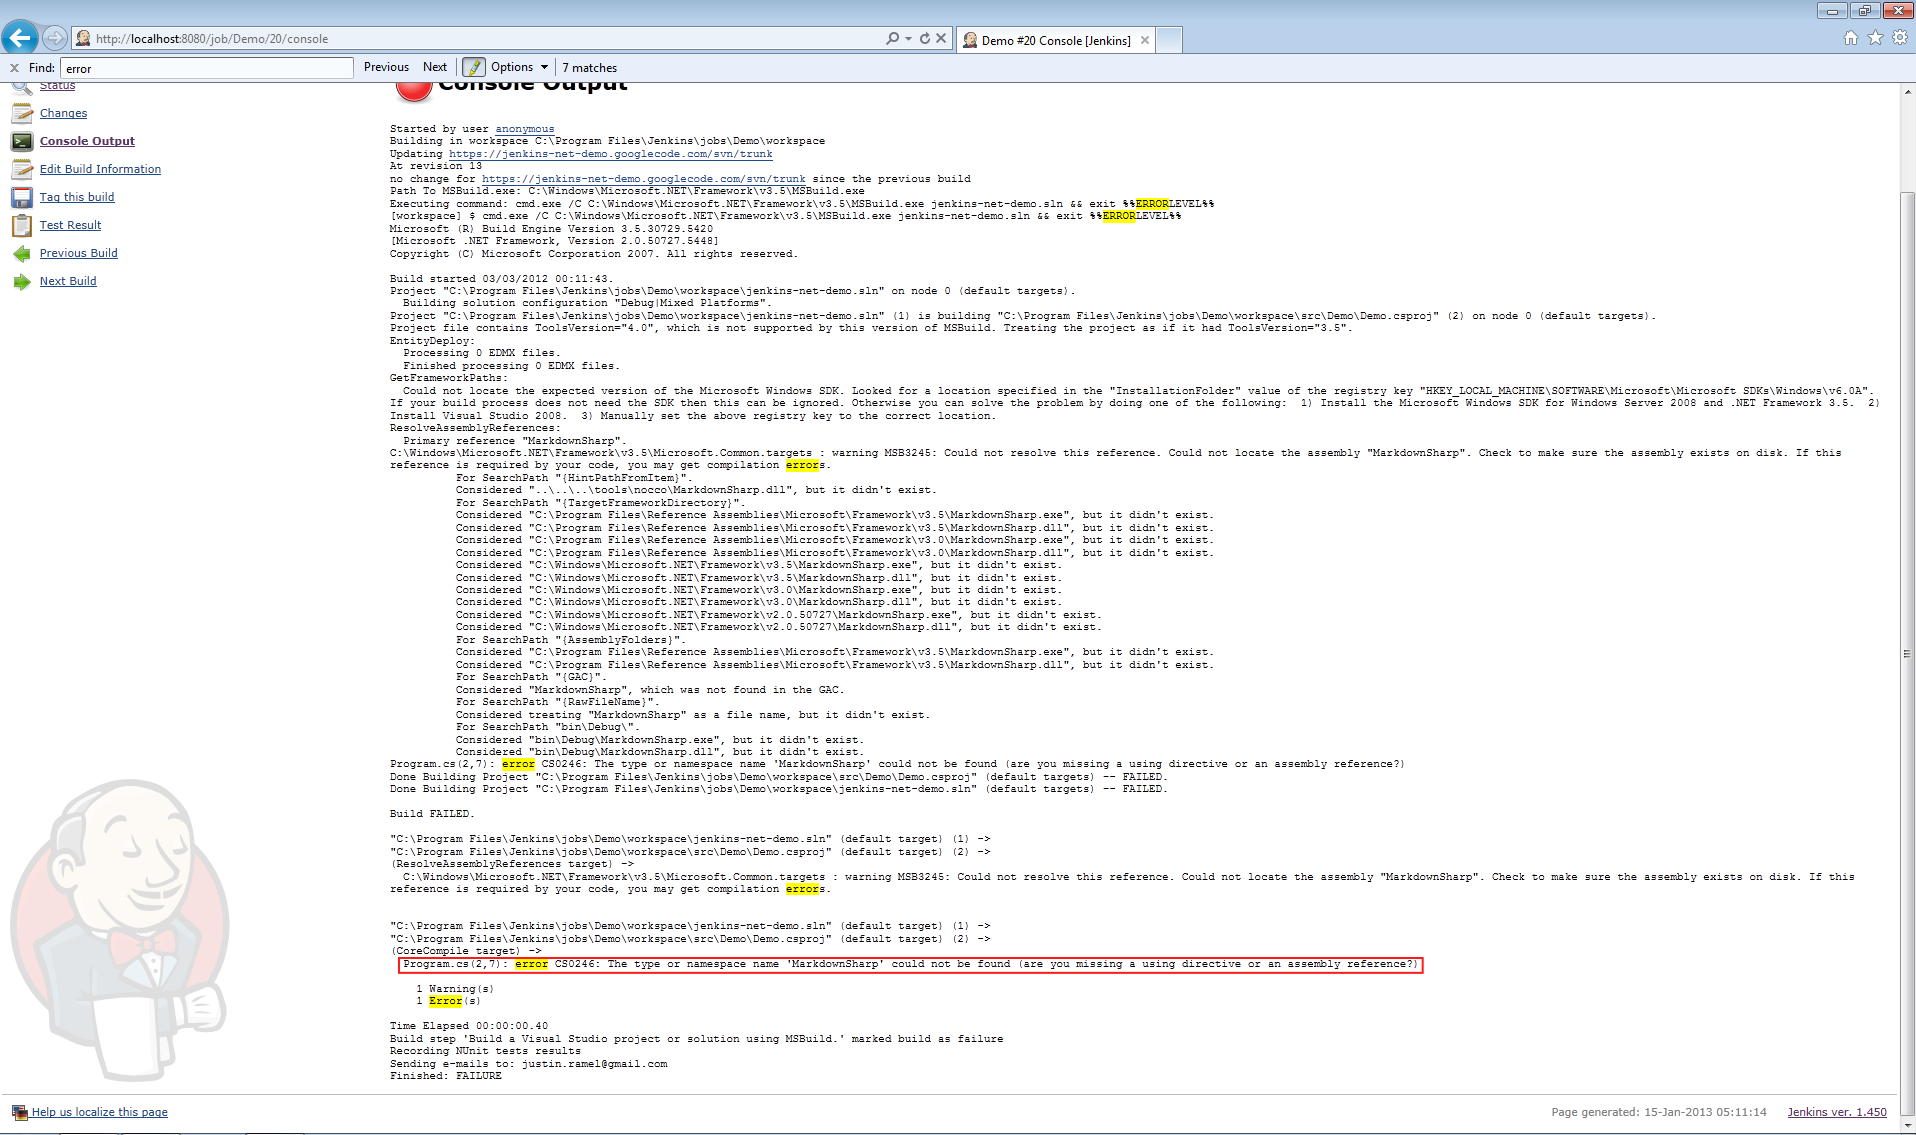
Of course once you get used to looking at this output it becomes easier. To help you get over this initially a simple search to find all the errors listed on the page can really help. Simply search for the word “error” and your browser will help you see again.

You now have only a few places to concentrate your efforts in that sea of information.
To fix the problem we can simply add the missing dll and Jenkins will rebuild the solution and we’ll be back to green balls.
Next time we’ll look at the different ways to monitor our build and it’s failures.